Metodología
A continuación describimos, en lenguaje sencillo, cómo procesa el Spanish Media Monitor (SMM) los informativos de televisión y qué se puede explorar en este sitio. Para una explicación técnica completa puedes descargar la metodología completa (PDF): readme_smm.pdf
Pipeline analítico
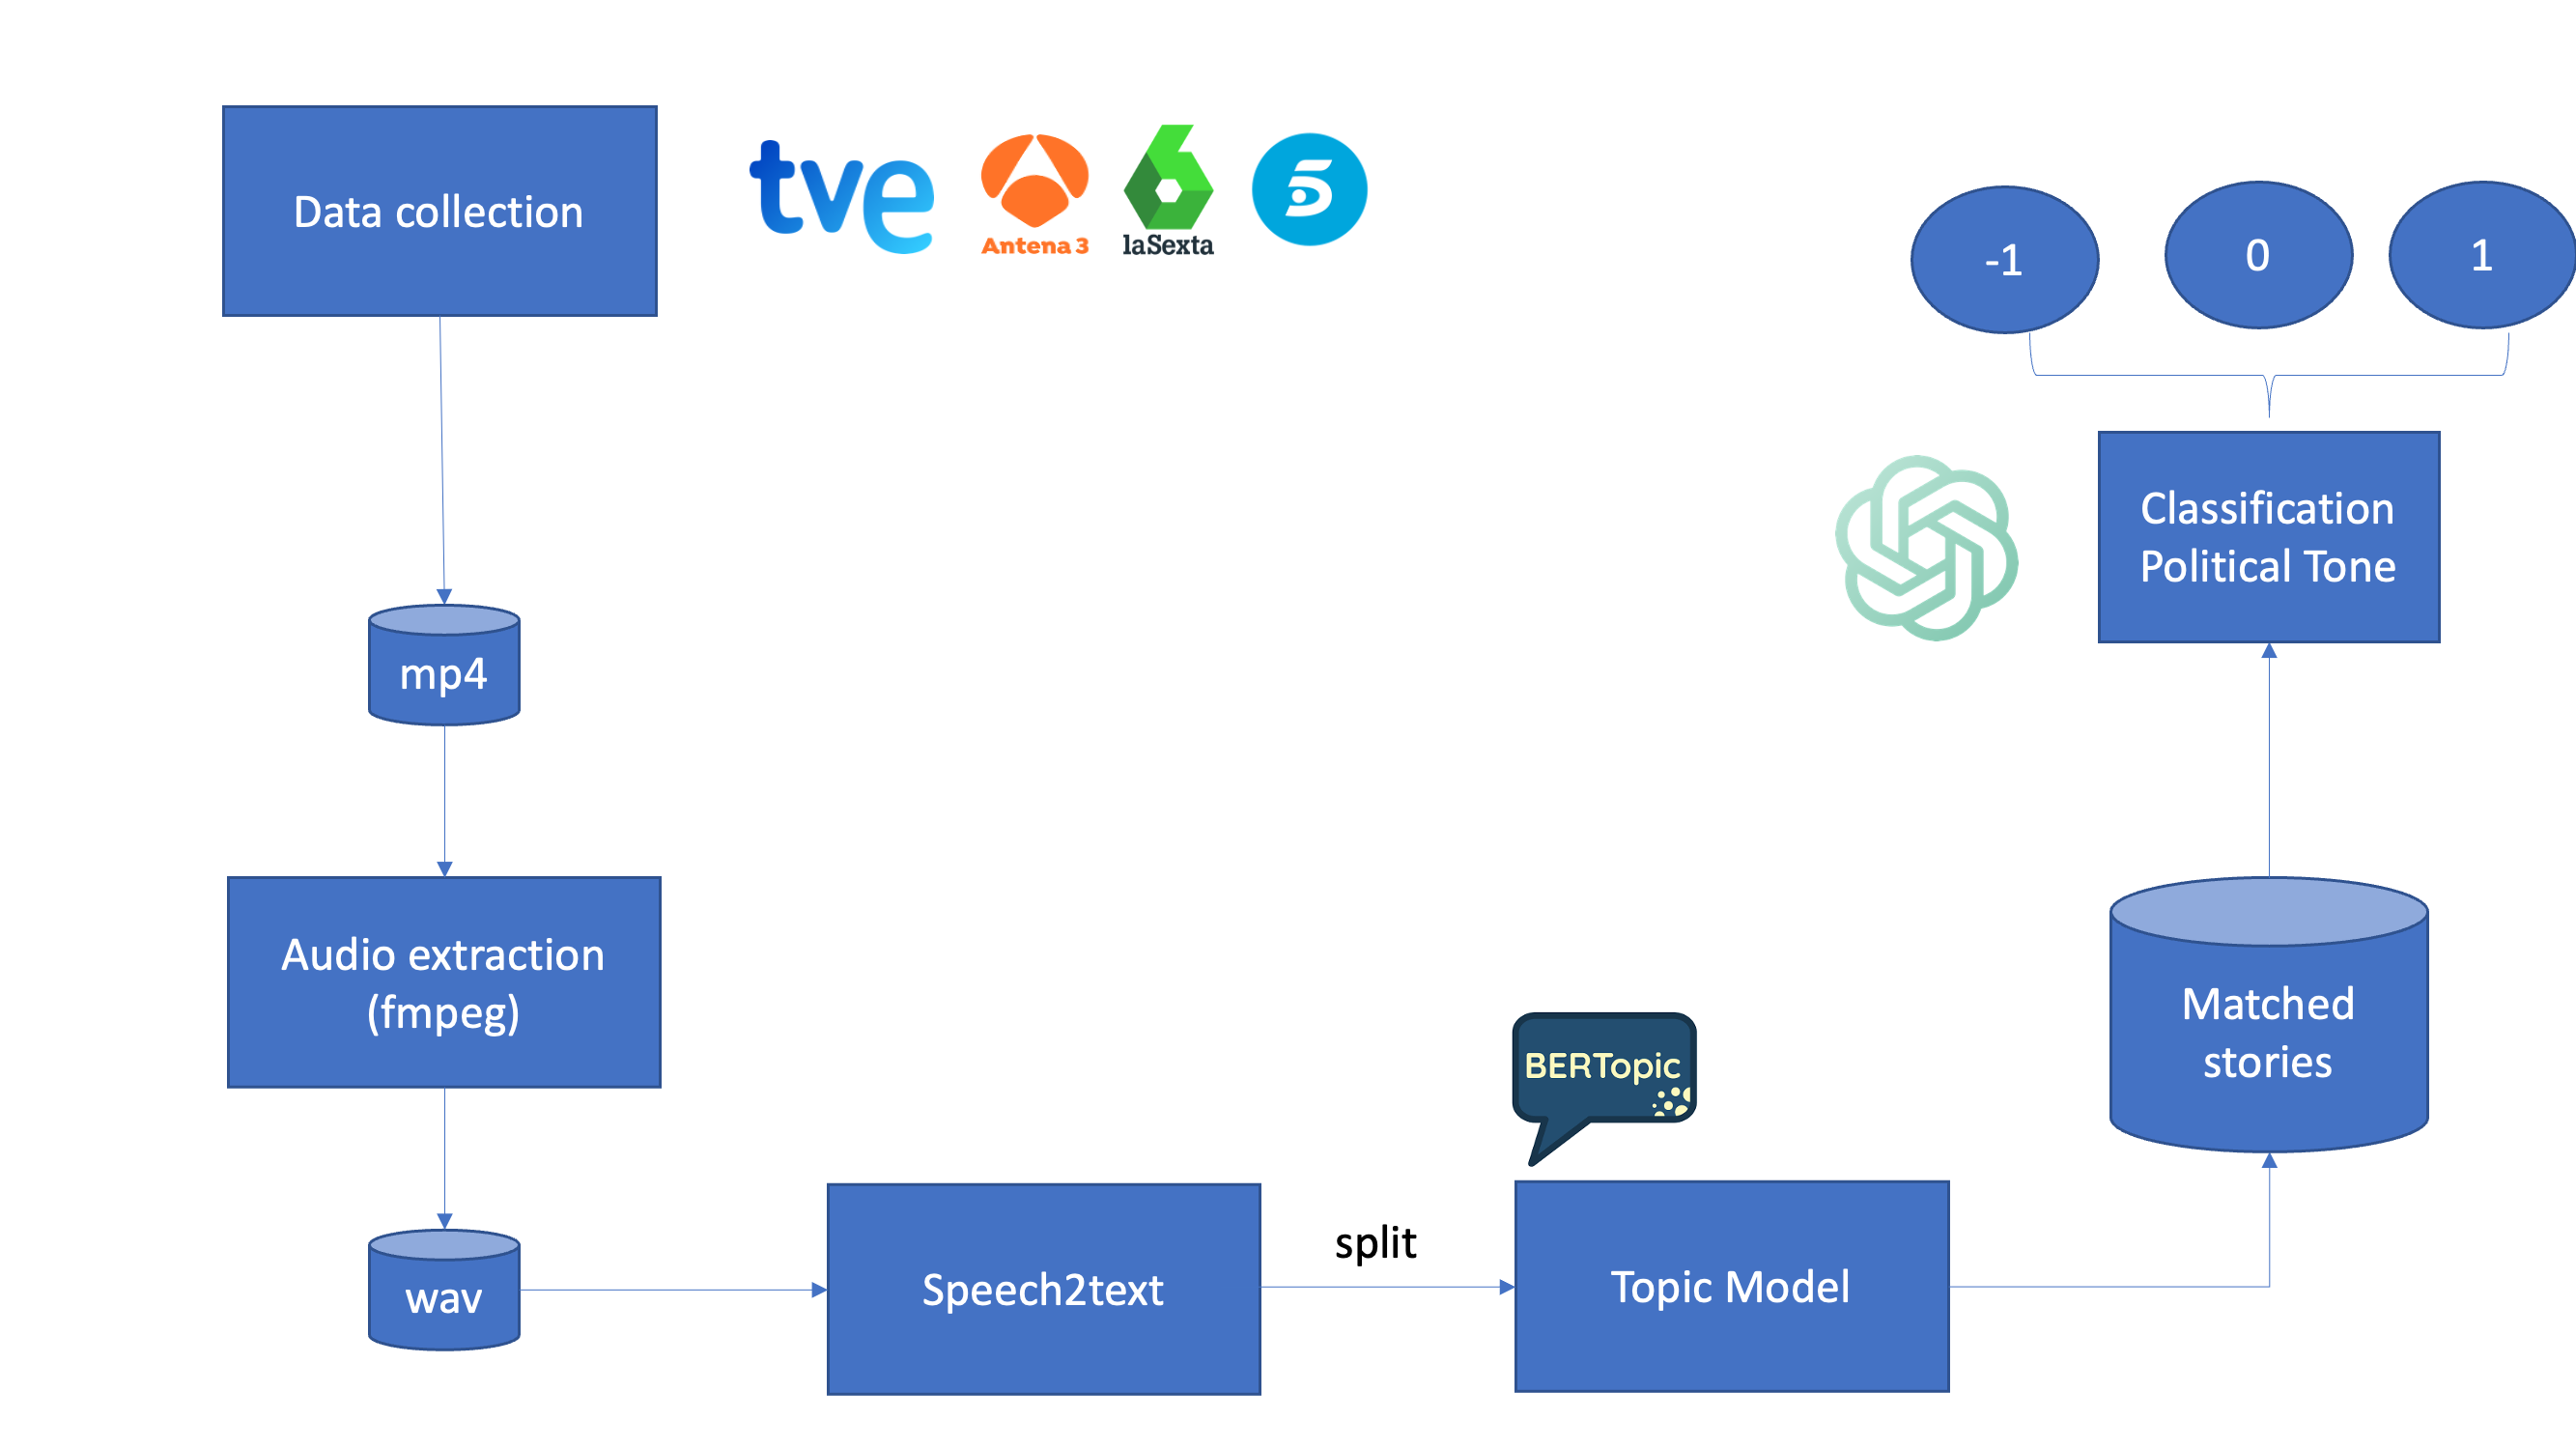
Recopilamos informativos de televisión, convertimos el audio en texto y aplicamos análisis automatizados para identificar quién es mencionado, qué temas aparecen y el tono de esas menciones. El siguiente diagrama ofrece una visión general de las etapas principales, desde los vídeos en bruto hasta los gráficos interactivos de este sitio.
Cómo se procesan los datos
- Extraemos el audio de las grabaciones de los informativos y lo transcribimos automáticamente.
- Las transcripciones se analizan para detectar menciones a partidos políticos y a políticos concretos.
- Agrupamos palabras y frases relacionadas en temas para ver qué noticias cubre cada cadena.
- Usamos modelos de lenguaje para estimar el tono (positivo, neutro, negativo) de cada mención, y resumimos esas puntuaciones a lo largo del tiempo y por cadena.
Cómo medimos el acuerdo y el desacuerdo entre cadenas
La nueva pestaña de "Acuerdo y Desacuerdo" combina dos medidas distintas. La primera es un índice de acuerdo editorial basado en la entropía de la distribución temática diaria. Lo mostramos invertido para que su lectura sea más intuitiva: valores más altos significan más concentración en un conjunto parecido de temas y, por tanto, más acuerdo entre agendas. Esta serie sirve para localizar rápidamente los días en los que los informativos se parecieron más o menos entre sí.
La segunda medida es el desacuerdo temático dentro de un día concreto. Para cada tema detectado automáticamente, calculamos qué porcentaje del tiempo político de cada cadena (los segmentos que mencionan a partidos o políticos) se dedica a ese tema. La diferencia entre la cadena que más y la que menos peso le da al mismo tema dentro de su propia agenda política es nuestra medida de desacuerdo: cuanto mayor es ese gap, más distintas son las prioridades editoriales; cuanto menor, más coinciden en lo que consideran noticia.
La vista interactiva permite seleccionar una fecha y ver tres capas a la vez: un mapa de calor que compara el peso de cada tema por cadena, un ranking de los temas donde más divergen y una mezcla editorial por canal para ese día. Las etiquetas visibles de los temas no son nombres escritos manualmente uno a uno: se generan a partir de los grupos de palabras detectados automáticamente y se muestran en una forma más legible para el lector.
Tono político (qué muestran los gráficos)
Cada vez que se menciona a un partido o político le asignamos una etiqueta de tono sencilla: negativo, neutro o positivo. Después promediamos esas etiquetas, excluyendo los días sin menciones, para que los gráficos muestren tendencias generales en cómo trata cada cadena a los distintos partidos.